


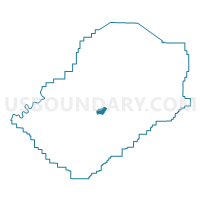
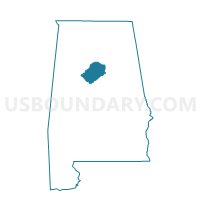
Census Tract 35, Jefferson County, Alabama
About
Outline

Summary
| Unique Area Identifier | 431697 |
| Name | Census Tract 35 |
| County | Jefferson County |
| State | Alabama |
| Area (square miles) | 2.86 |
| Land Area (square miles) | 2.86 |
| Water Area (square miles) | 0.00 |
| % of Land Area | 99.85 |
| % of Water Area | 0.15 |
| Latitude of the Internal Point | 33.50562380 |
| Longtitude of the Internal Point | -86.92427300 |
| Total Population | 2,795 |
| Total Housing Units | 1,309 |
| Total Households | 1,010 |
| Median Age | 32.2 |
Maps
Graphs
Select a template below for downloading or customizing gragh for Census Tract 35, Jefferson County, Alabama


Neighbors
Neighoring Census Tract (by Name) Neighboring Census Tract on the Map
- Census Tract 106.02, Jefferson County, AL
- Census Tract 123.04, Jefferson County, AL
- Census Tract 125, Jefferson County, AL
- Census Tract 139.01, Jefferson County, AL
- Census Tract 33, Jefferson County, AL
- Census Tract 34, Jefferson County, AL
Top 10 Neighboring County Subdivision (by Population) Neighboring County Subdivision on the Map
Top 10 Neighboring Place (by Population) Neighboring Place on the Map
- Birmingham city, AL (212,237)
- Fairfield city, AL (11,117)
- Pleasant Grove city, AL (10,110)
- McDonald Chapel CDP, AL (717)
Top 10 Neighboring Unified School District (by Population) Neighboring Unified School District on the Map
- Jefferson County School District, AL (230,679)
- Birmingham City School District, AL (212,237)
- Fairfield City School District, AL (11,117)
Top 10 Neighboring State Legislative District Lower Chamber (by Population) Neighboring State Legislative District Lower Chamber on the Map
- State House District 15, AL (48,965)
- State House District 60, AL (36,704)
- State House District 57, AL (36,199)
- State House District 55, AL (35,572)
Top 10 Neighboring State Legislative District Upper Chamber (by Population) Neighboring State Legislative District Upper Chamber on the Map
- State Senate District 5, AL (134,976)
- State Senate District 19, AL (109,165)
- State Senate District 20, AL (107,375)
Top 10 Neighboring 111th Congressional District (by Population) Neighboring 111th Congressional District on the Map
Top 10 Neighboring 5-Digit ZIP Code Tabulation Area (by Population) Neighboring 5-Digit ZIP Code Tabulation Area on the Map
Explore Neighbors on the MapData
Demographic, Population, Households, and Housing Units
** Data sources from census 2010 **
Show Data on Map
Download Full List as CSV
Download Quick Sheet as CSV
| Subject | This Area | Jefferson County | Alabama | National |
|---|---|---|---|---|
| POPULATION | ||||
| Total Population Map | 2,795 | 658,466 | 4,779,736 | 308,745,538 |
| POPULATION, HISPANIC OR LATINO ORIGIN | ||||
| Not Hispanic or Latino Map | 2,771 | 632,978 | 4,594,134 | 258,267,944 |
| Hispanic or Latino Map | 24 | 25,488 | 185,602 | 50,477,594 |
| POPULATION, RACE | ||||
| White alone Map | 291 | 349,166 | 3,275,394 | 223,553,265 |
| Black or African American alone Map | 2,444 | 276,525 | 1,251,311 | 38,929,319 |
| American Indian and Alaska Native alone Map | 12 | 1,740 | 28,218 | 2,932,248 |
| Asian alone Map | 2 | 9,158 | 53,595 | 14,674,252 |
| Native Hawaiian and Other Pacific Islander alone Map | 0 | 244 | 3,057 | 540,013 |
| Some Other Race alone Map | 11 | 14,358 | 96,910 | 19,107,368 |
| Two or More Races Map | 35 | 7,275 | 71,251 | 9,009,073 |
| POPULATION, SEX | ||||
| Male Map | 1,308 | 311,813 | 2,320,188 | 151,781,326 |
| Female Map | 1,487 | 346,653 | 2,459,548 | 156,964,212 |
| POPULATION, AGE (18 YEARS) | ||||
| 18 years and over Map | 2,006 | 503,938 | 3,647,277 | 234,564,071 |
| Under 18 years | 789 | 154,528 | 1,132,459 | 74,181,467 |
| POPULATION, AGE | ||||
| Under 5 years | 204 | 43,897 | 304,957 | 20,201,362 |
| 5 to 9 years | 232 | 41,902 | 308,229 | 20,348,657 |
| 10 to 14 years | 229 | 42,373 | 319,655 | 20,677,194 |
| 15 to 17 years | 124 | 26,356 | 199,618 | 12,954,254 |
| 18 and 19 years | 99 | 18,306 | 143,853 | 9,086,089 |
| 20 years | 63 | 9,038 | 72,318 | 4,519,129 |
| 21 years | 38 | 8,929 | 68,473 | 4,354,294 |
| 22 to 24 years | 132 | 28,438 | 194,531 | 12,712,576 |
| 25 to 29 years | 190 | 48,533 | 311,034 | 21,101,849 |
| 30 to 34 years | 179 | 44,764 | 297,888 | 19,962,099 |
| 35 to 39 years | 133 | 42,291 | 308,430 | 20,179,642 |
| 40 to 44 years | 162 | 41,302 | 311,071 | 20,890,964 |
| 45 to 49 years | 196 | 46,460 | 346,369 | 22,708,591 |
| 50 to 54 years | 225 | 48,773 | 347,485 | 22,298,125 |
| 55 to 59 years | 196 | 44,702 | 311,906 | 19,664,805 |
| 60 and 61 years | 67 | 15,885 | 116,144 | 7,113,727 |
| 62 to 64 years | 70 | 20,074 | 159,983 | 9,704,197 |
| 65 and 66 years | 33 | 10,637 | 89,406 | 5,319,902 |
| 67 to 69 years | 38 | 14,397 | 120,231 | 7,115,361 |
| 70 to 74 years | 57 | 19,239 | 160,864 | 9,278,166 |
| 75 to 79 years | 48 | 15,956 | 122,836 | 7,317,795 |
| 80 to 84 years | 51 | 13,671 | 88,771 | 5,743,327 |
| 85 years and over | 29 | 12,543 | 75,684 | 5,493,433 |
| MEDIAN AGE BY SEX | ||||
| Both sexes Map | 32.20 | 37.10 | 37.90 | 37.20 |
| Male Map | 28.30 | 35.30 | 36.40 | 35.80 |
| Female Map | 35.40 | 38.60 | 39.10 | 38.50 |
| HOUSEHOLDS | ||||
| Total Households Map | 1,010 | 263,568 | 1,883,791 | 116,716,292 |
| HOUSEHOLDS, HOUSEHOLD TYPE | ||||
| Family households: Map | 688 | 170,207 | 1,276,440 | 77,538,296 |
| Husband-wife family Map | 236 | 110,228 | 902,556 | 56,510,377 |
| Other family: Map | 452 | 59,979 | 373,884 | 21,027,919 |
| Male householder, no wife present Map | 78 | 11,507 | 86,147 | 5,777,570 |
| Female householder, no husband present Map | 374 | 48,472 | 287,737 | 15,250,349 |
| Nonfamily households: Map | 322 | 93,361 | 607,351 | 39,177,996 |
| Householder living alone Map | 282 | 79,406 | 516,696 | 31,204,909 |
| Householder not living alone Map | 40 | 13,955 | 90,655 | 7,973,087 |
| HOUSEHOLDS, HISPANIC OR LATINO ORIGIN OF HOUSEHOLDER | ||||
| Not Hispanic or Latino householder: Map | 1,006 | 256,778 | 1,836,557 | 103,254,926 |
| Hispanic or Latino householder: Map | 4 | 6,790 | 47,234 | 13,461,366 |
| HOUSEHOLDS, RACE OF HOUSEHOLDER | ||||
| Householder who is White alone | 144 | 147,407 | 1,339,068 | 89,754,352 |
| Householder who is Black or African American alone | 853 | 106,484 | 472,208 | 14,129,983 |
| Householder who is American Indian and Alaska Native alone | 5 | 664 | 11,057 | 939,707 |
| Householder who is Asian alone | 0 | 3,205 | 17,275 | 4,632,164 |
| Householder who is Native Hawaiian and Other Pacific Islander alone | 0 | 84 | 899 | 143,932 |
| Householder who is Some Other Race alone | 3 | 3,633 | 23,630 | 4,916,427 |
| Householder who is Two or More Races | 5 | 2,091 | 19,654 | 2,199,727 |
| HOUSEHOLDS, HOUSEHOLD TYPE BY HOUSEHOLD SIZE | ||||
| Family households: Map | 688 | 170,207 | 1,276,440 | 77,538,296 |
| 2-person household Map | 223 | 71,787 | 559,181 | 31,882,616 |
| 3-person household Map | 188 | 42,926 | 311,512 | 17,765,829 |
| 4-person household Map | 125 | 32,472 | 240,978 | 15,214,075 |
| 5-person household Map | 82 | 14,436 | 105,643 | 7,411,997 |
| 6-person household Map | 36 | 5,341 | 37,152 | 3,026,278 |
| 7-or-more-person household Map | 34 | 3,245 | 21,974 | 2,237,501 |
| Nonfamily households: Map | 322 | 93,361 | 607,351 | 39,177,996 |
| 1-person household Map | 282 | 79,406 | 516,696 | 31,204,909 |
| 2-person household Map | 31 | 11,460 | 73,110 | 6,360,012 |
| 3-person household Map | 5 | 1,674 | 11,429 | 992,156 |
| 4-person household Map | 1 | 566 | 4,348 | 411,171 |
| 5-person household Map | 2 | 145 | 1,128 | 126,634 |
| 6-person household Map | 1 | 61 | 358 | 48,421 |
| 7-or-more-person household Map | 0 | 49 | 282 | 34,693 |
| HOUSING UNITS | ||||
| Total Housing Units Map | 1,309 | 300,552 | 2,171,853 | 131,704,730 |
| HOUSING UNITS, OCCUPANCY STATUS | ||||
| Occupied Map | 1,010 | 263,568 | 1,883,791 | 116,716,292 |
| Vacant Map | 299 | 36,984 | 288,062 | 14,988,438 |
| HOUSING UNITS, OCCUPIED, TENURE | ||||
| Owned with a mortgage or a loan Map | 342 | 120,593 | 832,010 | 52,979,430 |
| Owned free and clear Map | 206 | 50,565 | 480,579 | 23,006,644 |
| Renter occupied Map | 462 | 92,410 | 571,202 | 40,730,218 |
| HOUSING UNITS, VACANT, VACANCY STATUS | ||||
| For rent Map | 138 | 14,308 | 79,265 | 4,137,567 |
| Rented, not occupied Map | 16 | 572 | 3,761 | 206,825 |
| For sale only Map | 25 | 6,054 | 35,903 | 1,896,796 |
| Sold, not occupied Map | 7 | 853 | 9,227 | 421,032 |
| For seasonal, recreational, or occasional use Map | 0 | 1,337 | 63,890 | 4,649,298 |
| For migrant workers Map | 0 | 9 | 238 | 24,161 |
| Other vacant Map | 113 | 13,851 | 95,778 | 3,652,759 |
| HOUSING UNITS, OCCUPIED, AVERAGE HOUSEHOLD SIZE BY TENURE | ||||
| Total: Map | 2.76 | 2.44 | 2.48 | 2.58 |
| Owner occupied Map | 2.45 | 2.50 | 2.52 | 2.65 |
| Renter occupied Map | 3.12 | 2.32 | 2.37 | 2.44 |
| HOUSING UNITS, OCCUPIED, TENURE BY RACE OF HOUSEHOLDER | ||||
| Owner occupied: Map | 548 | 171,158 | 1,312,589 | 75,986,074 |
| Householder who is White alone Map | 93 | 112,658 | 1,021,059 | 63,446,275 |
| Householder who is Black or African American alone Map | 450 | 54,491 | 254,596 | 6,261,464 |
| Householder who is American Indian and Alaska Native alone Map | 1 | 364 | 7,637 | 509,588 |
| Householder who is Asian alone Map | 0 | 1,634 | 9,284 | 2,688,861 |
| Householder who is Native Hawaiian and Other Pacific Islander alone Map | 0 | 30 | 359 | 61,911 |
| Householder who is Some Other Race alone Map | 1 | 960 | 8,345 | 1,975,817 |
| Householder who is Two or More Races Map | 3 | 1,021 | 11,309 | 1,042,158 |
| Renter occupied: Map | 462 | 92,410 | 571,202 | 40,730,218 |
| Householder who is White alone Map | 51 | 34,749 | 318,009 | 26,308,077 |
| Householder who is Black or African American alone Map | 403 | 51,993 | 217,612 | 7,868,519 |
| Householder who is American Indian and Alaska Native alone Map | 4 | 300 | 3,420 | 430,119 |
| Householder who is Asian alone Map | 0 | 1,571 | 7,991 | 1,943,303 |
| Householder who is Native Hawaiian and Other Pacific Islander alone Map | 0 | 54 | 540 | 82,021 |
| Householder who is Some Other Race alone Map | 2 | 2,673 | 15,285 | 2,940,610 |
| Householder who is Two or More Races Map | 2 | 1,070 | 8,345 | 1,157,569 |
| HOUSING UNITS, OCCUPIED, TENURE BY HISPANIC OR LATINO ORIGIN OF HOUSEHOLDER | ||||
| Owner occupied: Map | 548 | 171,158 | 1,312,589 | 75,986,074 |
| Not Hispanic or Latino householder Map | 547 | 168,958 | 1,292,679 | 69,617,625 |
| Hispanic or Latino householder Map | 1 | 2,200 | 19,910 | 6,368,449 |
| Renter occupied: Map | 462 | 92,410 | 571,202 | 40,730,218 |
| Not Hispanic or Latino householder Map | 459 | 87,820 | 543,878 | 33,637,301 |
| Hispanic or Latino householder Map | 3 | 4,590 | 27,324 | 7,092,917 |
| HOUSING UNITS, OCCUPIED, TENURE BY HOUSEHOLD SIZE | ||||
| Owner occupied: Map | 548 | 171,158 | 1,312,589 | 75,986,074 |
| 1-person household Map | 179 | 43,147 | 305,558 | 16,453,569 |
| 2-person household Map | 155 | 60,062 | 485,458 | 27,618,605 |
| 3-person household Map | 98 | 29,852 | 228,710 | 12,517,563 |
| 4-person household Map | 57 | 23,175 | 179,211 | 10,998,793 |
| 5-person household Map | 36 | 9,748 | 74,745 | 5,057,765 |
| 6-person household Map | 15 | 3,273 | 24,906 | 1,965,796 |
| 7-or-more-person household Map | 8 | 1,901 | 14,001 | 1,373,983 |
| Renter occupied: Map | 462 | 92,410 | 571,202 | 40,730,218 |
| 1-person household Map | 103 | 36,259 | 211,138 | 14,751,340 |
| 2-person household Map | 99 | 23,185 | 146,833 | 10,624,023 |
| 3-person household Map | 95 | 14,748 | 94,231 | 6,240,422 |
| 4-person household Map | 69 | 9,863 | 66,115 | 4,626,453 |
| 5-person household Map | 48 | 4,833 | 32,026 | 2,480,866 |
| 6-person household Map | 22 | 2,129 | 12,604 | 1,108,903 |
| 7-or-more-person household Map | 26 | 1,393 | 8,255 | 898,211 |
Loading...